Hargreaves Lansdown, the UK’s largest investment platform for private investors, launched a US focused fund in October with the strapline, “TOO BIG TO IGNORE”. The US is indeed too big to ignore and has many advantages: the reserve currency, the English language, two borders with smaller and friendly neighbours, energy independence, a transparent legal system with strong checks and balances, the most powerful military in the world, a persistent ‘brain gain’ and a dynamic, vibrant, capitalist economy. All very compelling, however, it has now been over a decade of consistent US outperformance. Furthermore, valuations in America, when compared with the rest of the world, are at an extreme. To quote Warren Buffett, “all bubbles start with a sound premise and then the price action takes over.” According to JP Morgan, the valuation difference between the US and the rest of the world is now over two standard deviations away from its mean, meaning this should happen less than 5% of the time.
The MSCI World Index includes just over 600 US companies out of 1,500 (40%). This seems reasonable given that it is a developed market index which excludes companies from about half of the world’s economy. However there the reasonableness ends: there is only one non-US company in the top 25 by size (Nestle at 18), 77 of the top 100 are from the US and by weighting, the US represents a staggering 70% of the index, the highest it has ever been. This is despite the US economy falling from 30% of global GDP twenty years ago, to just 16% today. It is worth remembering that in the late 80s, eight out of the top ten companies in the world were Japanese and ten years ago, only five of the top ten companies were from the United States.
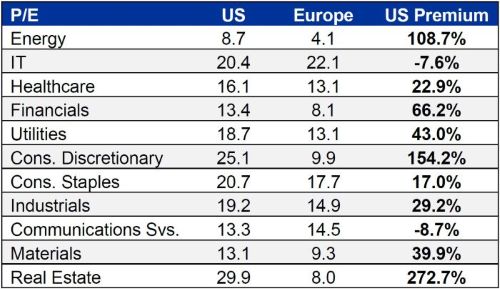
Some argue that the large global tech companies such as Apple, Alphabet and Microsoft, which make up a sizable portion of the large cap index, are mistakenly seen as US companies when in fact about half their earnings come from abroad – of course this was also true of IBM, GE and Exxon historically. However, we find that US dominance is true across all global indices right the way down the market cap range: for example, in the Small and Mid-Cap index there are no non-US companies in the top 25 by weighting and just one in the top 50. Surprisingly, it is also not the IT and Communication Service sectors that trade at a premium, rather it is every other sector (see table below).

Source: Bloomberg. Date: as at 7th November 2022
We find particularly large differences in valuations when looking at purely domestic companies in the US compared to domestic companies outside the US; for example, Kingfisher, the European home improvement retailer, trades on 7x earnings while Home Depot in the US trades on 18x – a 150%+ premium. However, it is perhaps more instructive to look at large global companies that are exposed to similar end markets, with similar growth trajectories but currently trade on different valuations.
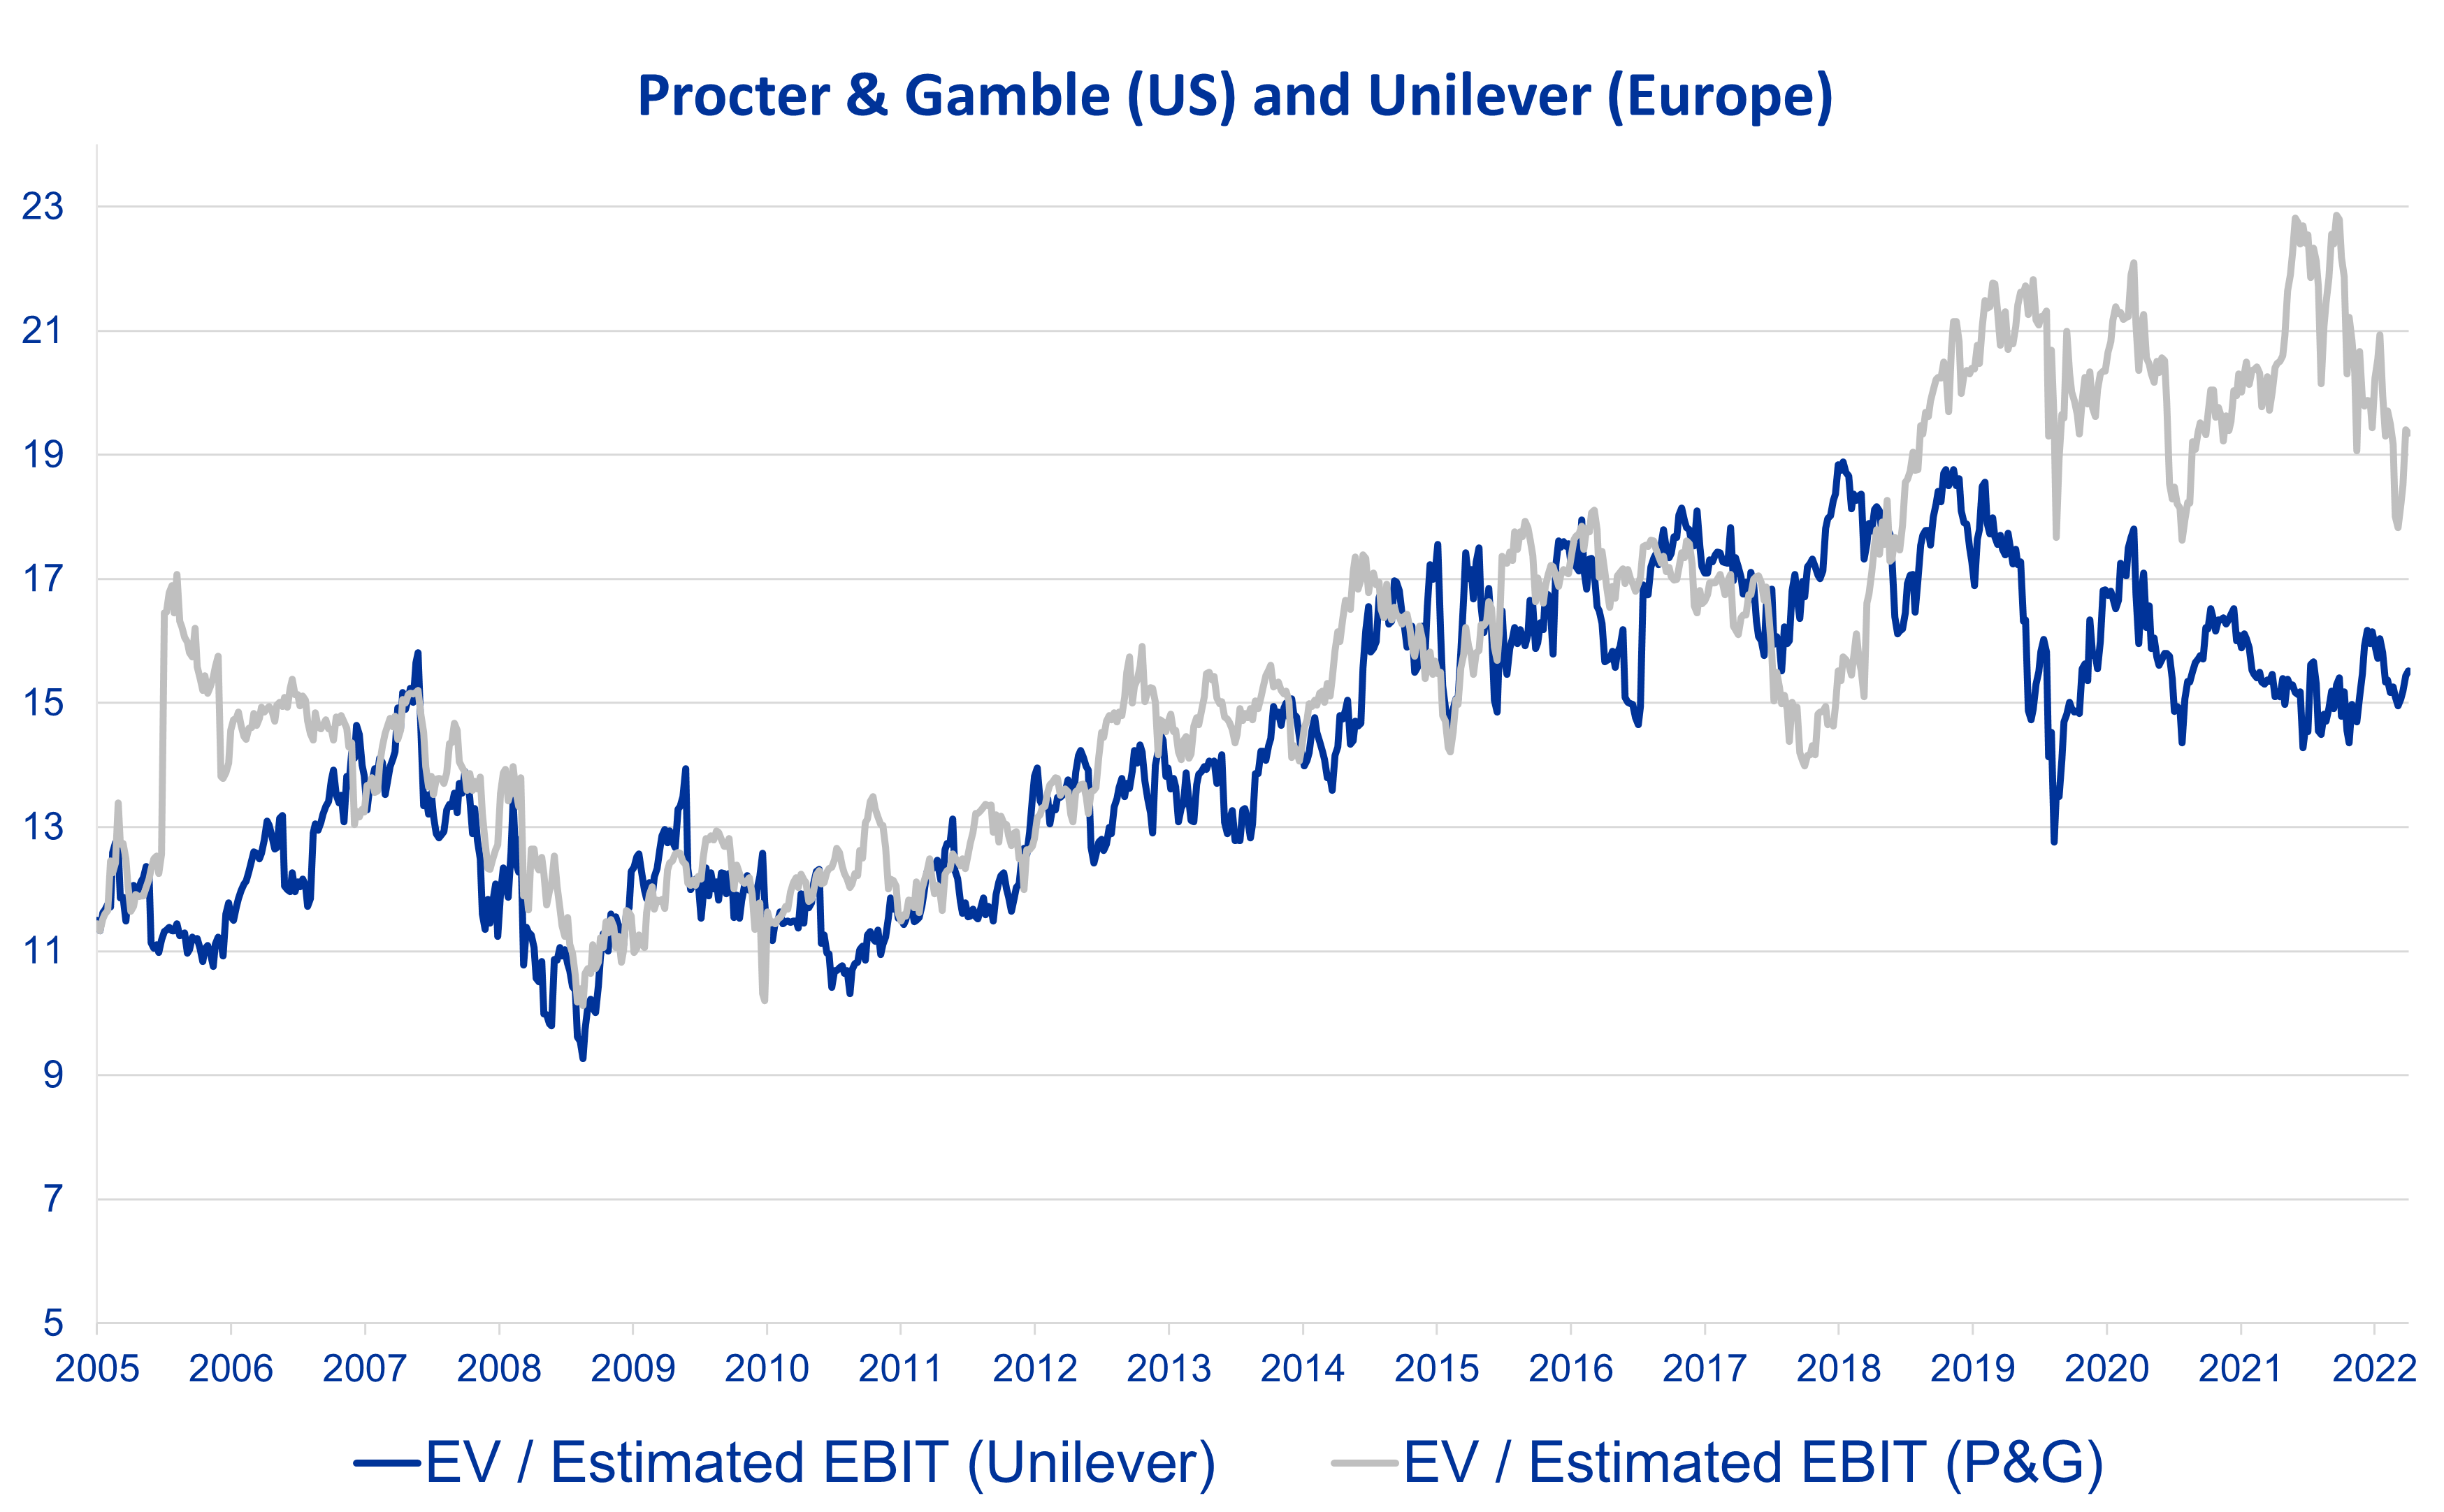
Let’s start with Procter and Gamble (US) and compare it to Unilever (Europe), two long established consumer goods companies. Both companies offer a broad array of consumer brands with strong market positions and their growth has been similar over the very long run. In fact, so similar that for the 29 years ending in 2018 they delivered near identical returns of 11% per annum in USD. However in 2018 their performance began to diverge.
Below shows the enterprise value to operating profits of the two companies. As can be seen from the chart, they have historically traded at the same valuation but, since 2018, their valuations diverged with P&G the US listed company, becoming significantly more expensive. If Unilever was valued on the same multiple as P&G is, its share price would be 30% higher.

Source: Bloomberg. Date: as at 4th November 2022
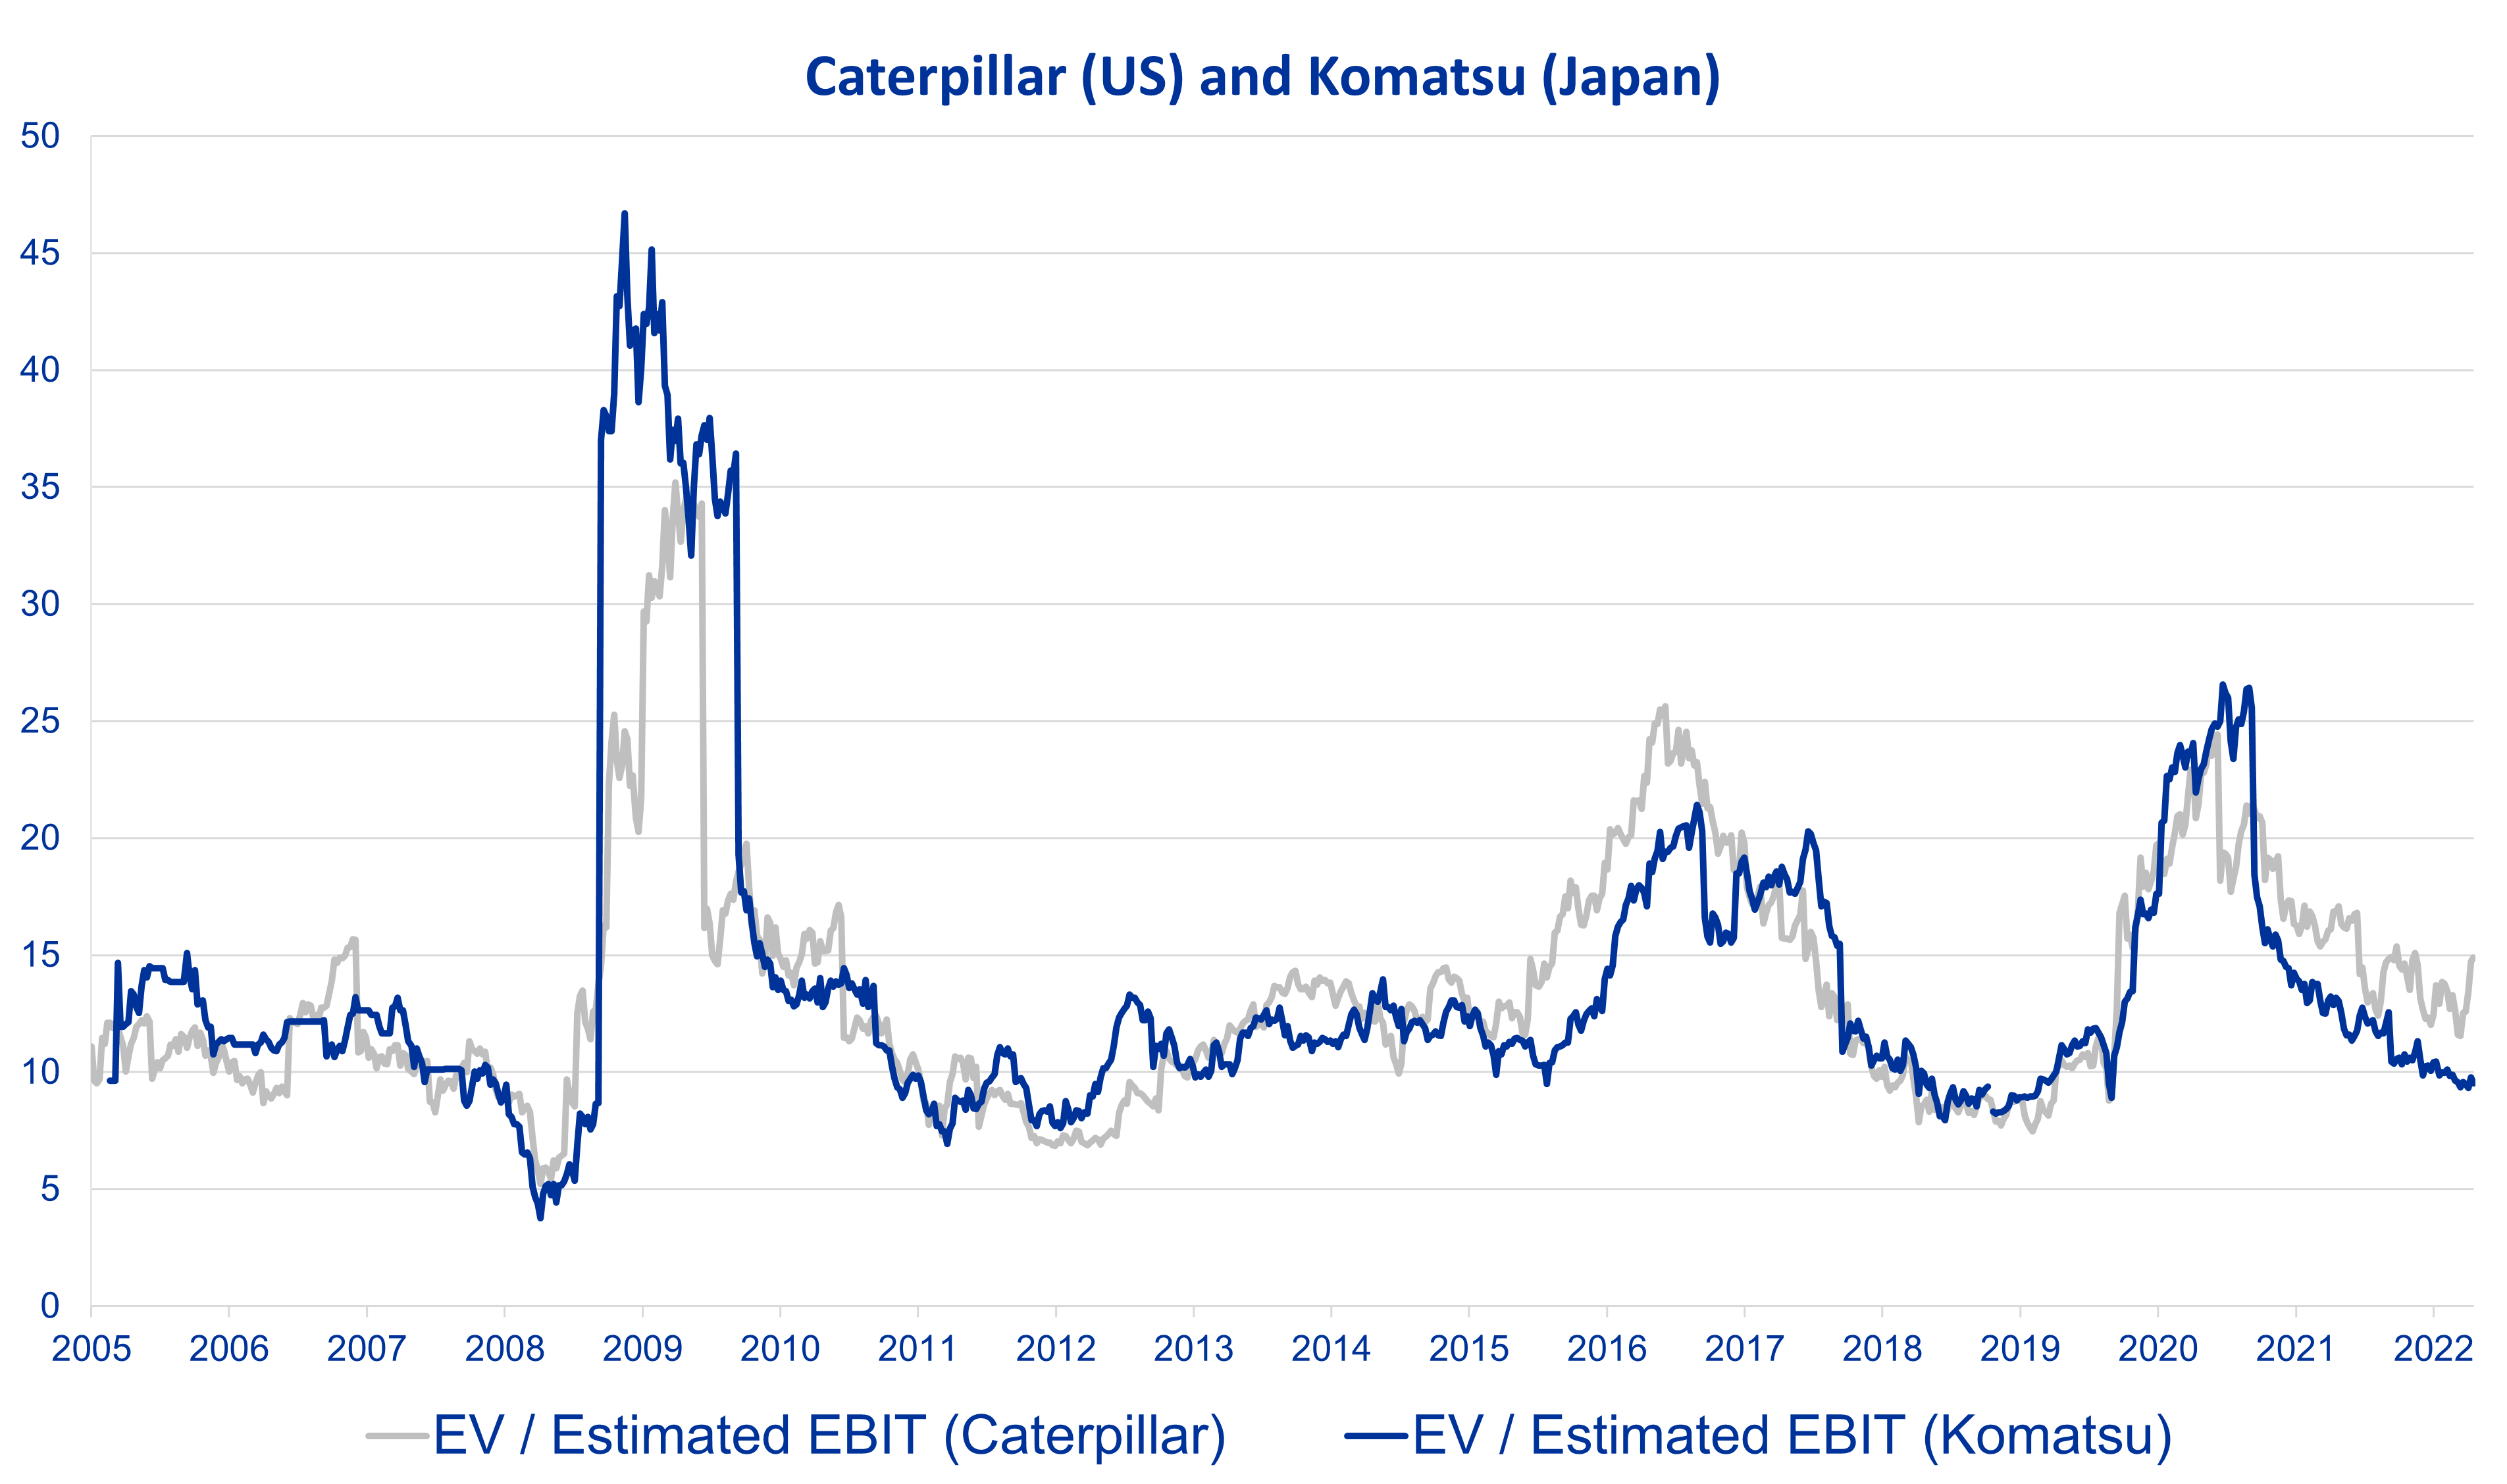
Caterpillar (US) and Komatsu (Japan) are two dominant global mining and construction equipment manufacturers. They too have very similar underlying trends, trading on near identical multiples over the very long run but their valuations have recently diverged as well. The magnitude might not seem significant when looking at the chart below, but if Komatsu was valued at the same multiple as Caterpillar, it would be 75% higher.

Source: Bloomberg. Date: as at 4th November 2022
Finally let’s look at energy. The largest energy company in the United States is Exxon and the largest in Europe is Shell. Both are globally diversified oil and gas businesses with similar historic and future growth outlooks. Exxon trades on a 100% premium based on EV/EBIT and 80% based on net earnings. Over the last 12 months Exxon has returned 5% to shareholders through dividends and buybacks while Shell has returned 14%.
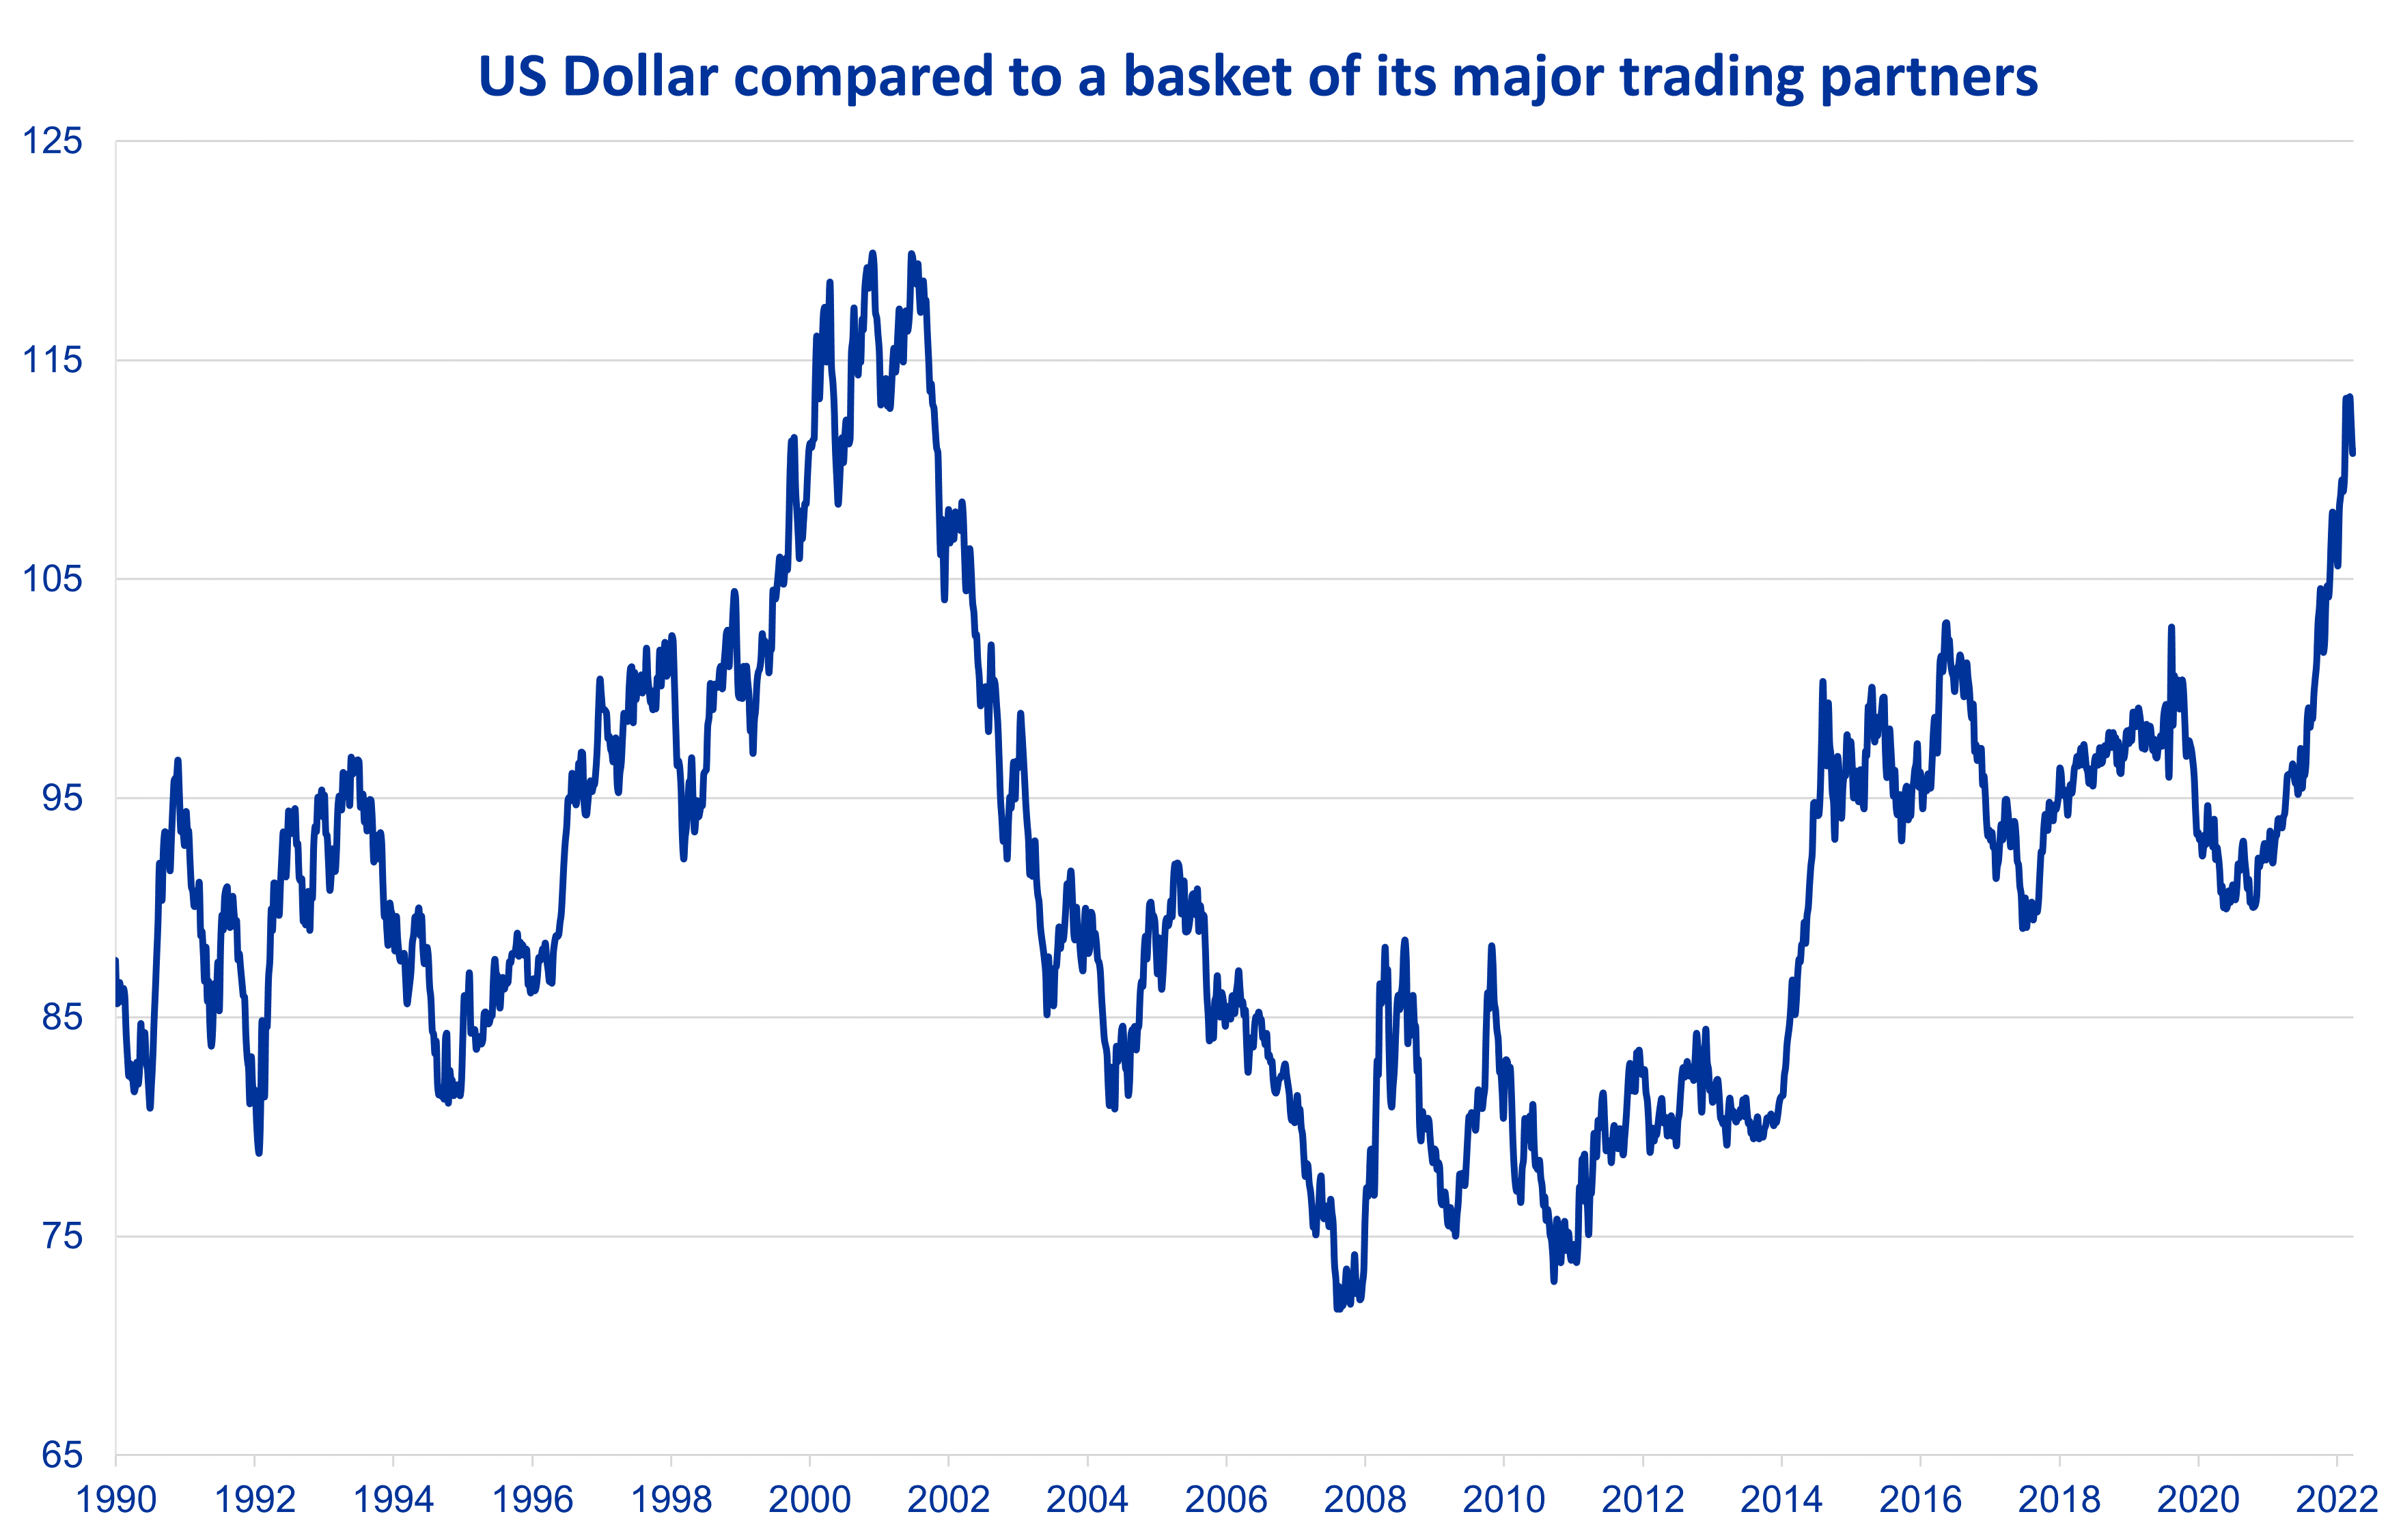
Outperformance of the US compared to the rest of the world has tended to go hand in hand with US dollar strength. We have now had 14 years of consistent outperformance from the US market as well as relative strength from its currency. The chart below shows the US dollar compared to a basket of its major trading partners. The last time it was this strong was in 2000, following which the US underperformed for eight straight years. While we do not know the timing of the reversal, we are confident that we are near that point after such a long period of US outperformance. Additionally, we believe that passive investment in ‘global’ indices which has 70% allocated to one of the most expensive markets is neither diversified nor likely to provide good returns in the coming decade.

Source: Bloomberg. Date: as at 4th November 2022


