The last couple of months has seen the failure of four large banks: Silicon Valley Bank (SVB), Signature Bank, Credit Suisse and First Republic Bank (FRC). Each of these have been explained by ‘idiosyncratic’ factors. Credit Suisse was an idiosyncratic issue of a rotten culture. However, the issues at SVB, Signature and FRC have much in common.
Debate has centred around the cause of failure at the US banks but ultimately these banks lost confidence of depositors, and regulators, leading to deposit flight. The distress was not primarily caused by concerns over credit risk, the ultimate cause of the 2008 crisis, but due to a combination of flighty deposits and reaching for yield.
At their heart, these banks failed to heed the advice of the 19th Century banker Walter Bagehot:
“The business of banking ought to be simple. If it is hard it is wrong. The only securities which a banker, using money that he may be asked at short notice to repay, ought to touch, are those which are easily saleable and easily intelligible.”
We are confident that the banks that Oldfield Partners (OP) are invested in have not taken on these same risks – they have less flighty deposits, substantially higher liquidity and less duration risk in their loan books than the banks that have failed.
Flighty Deposits and Low Liquidity
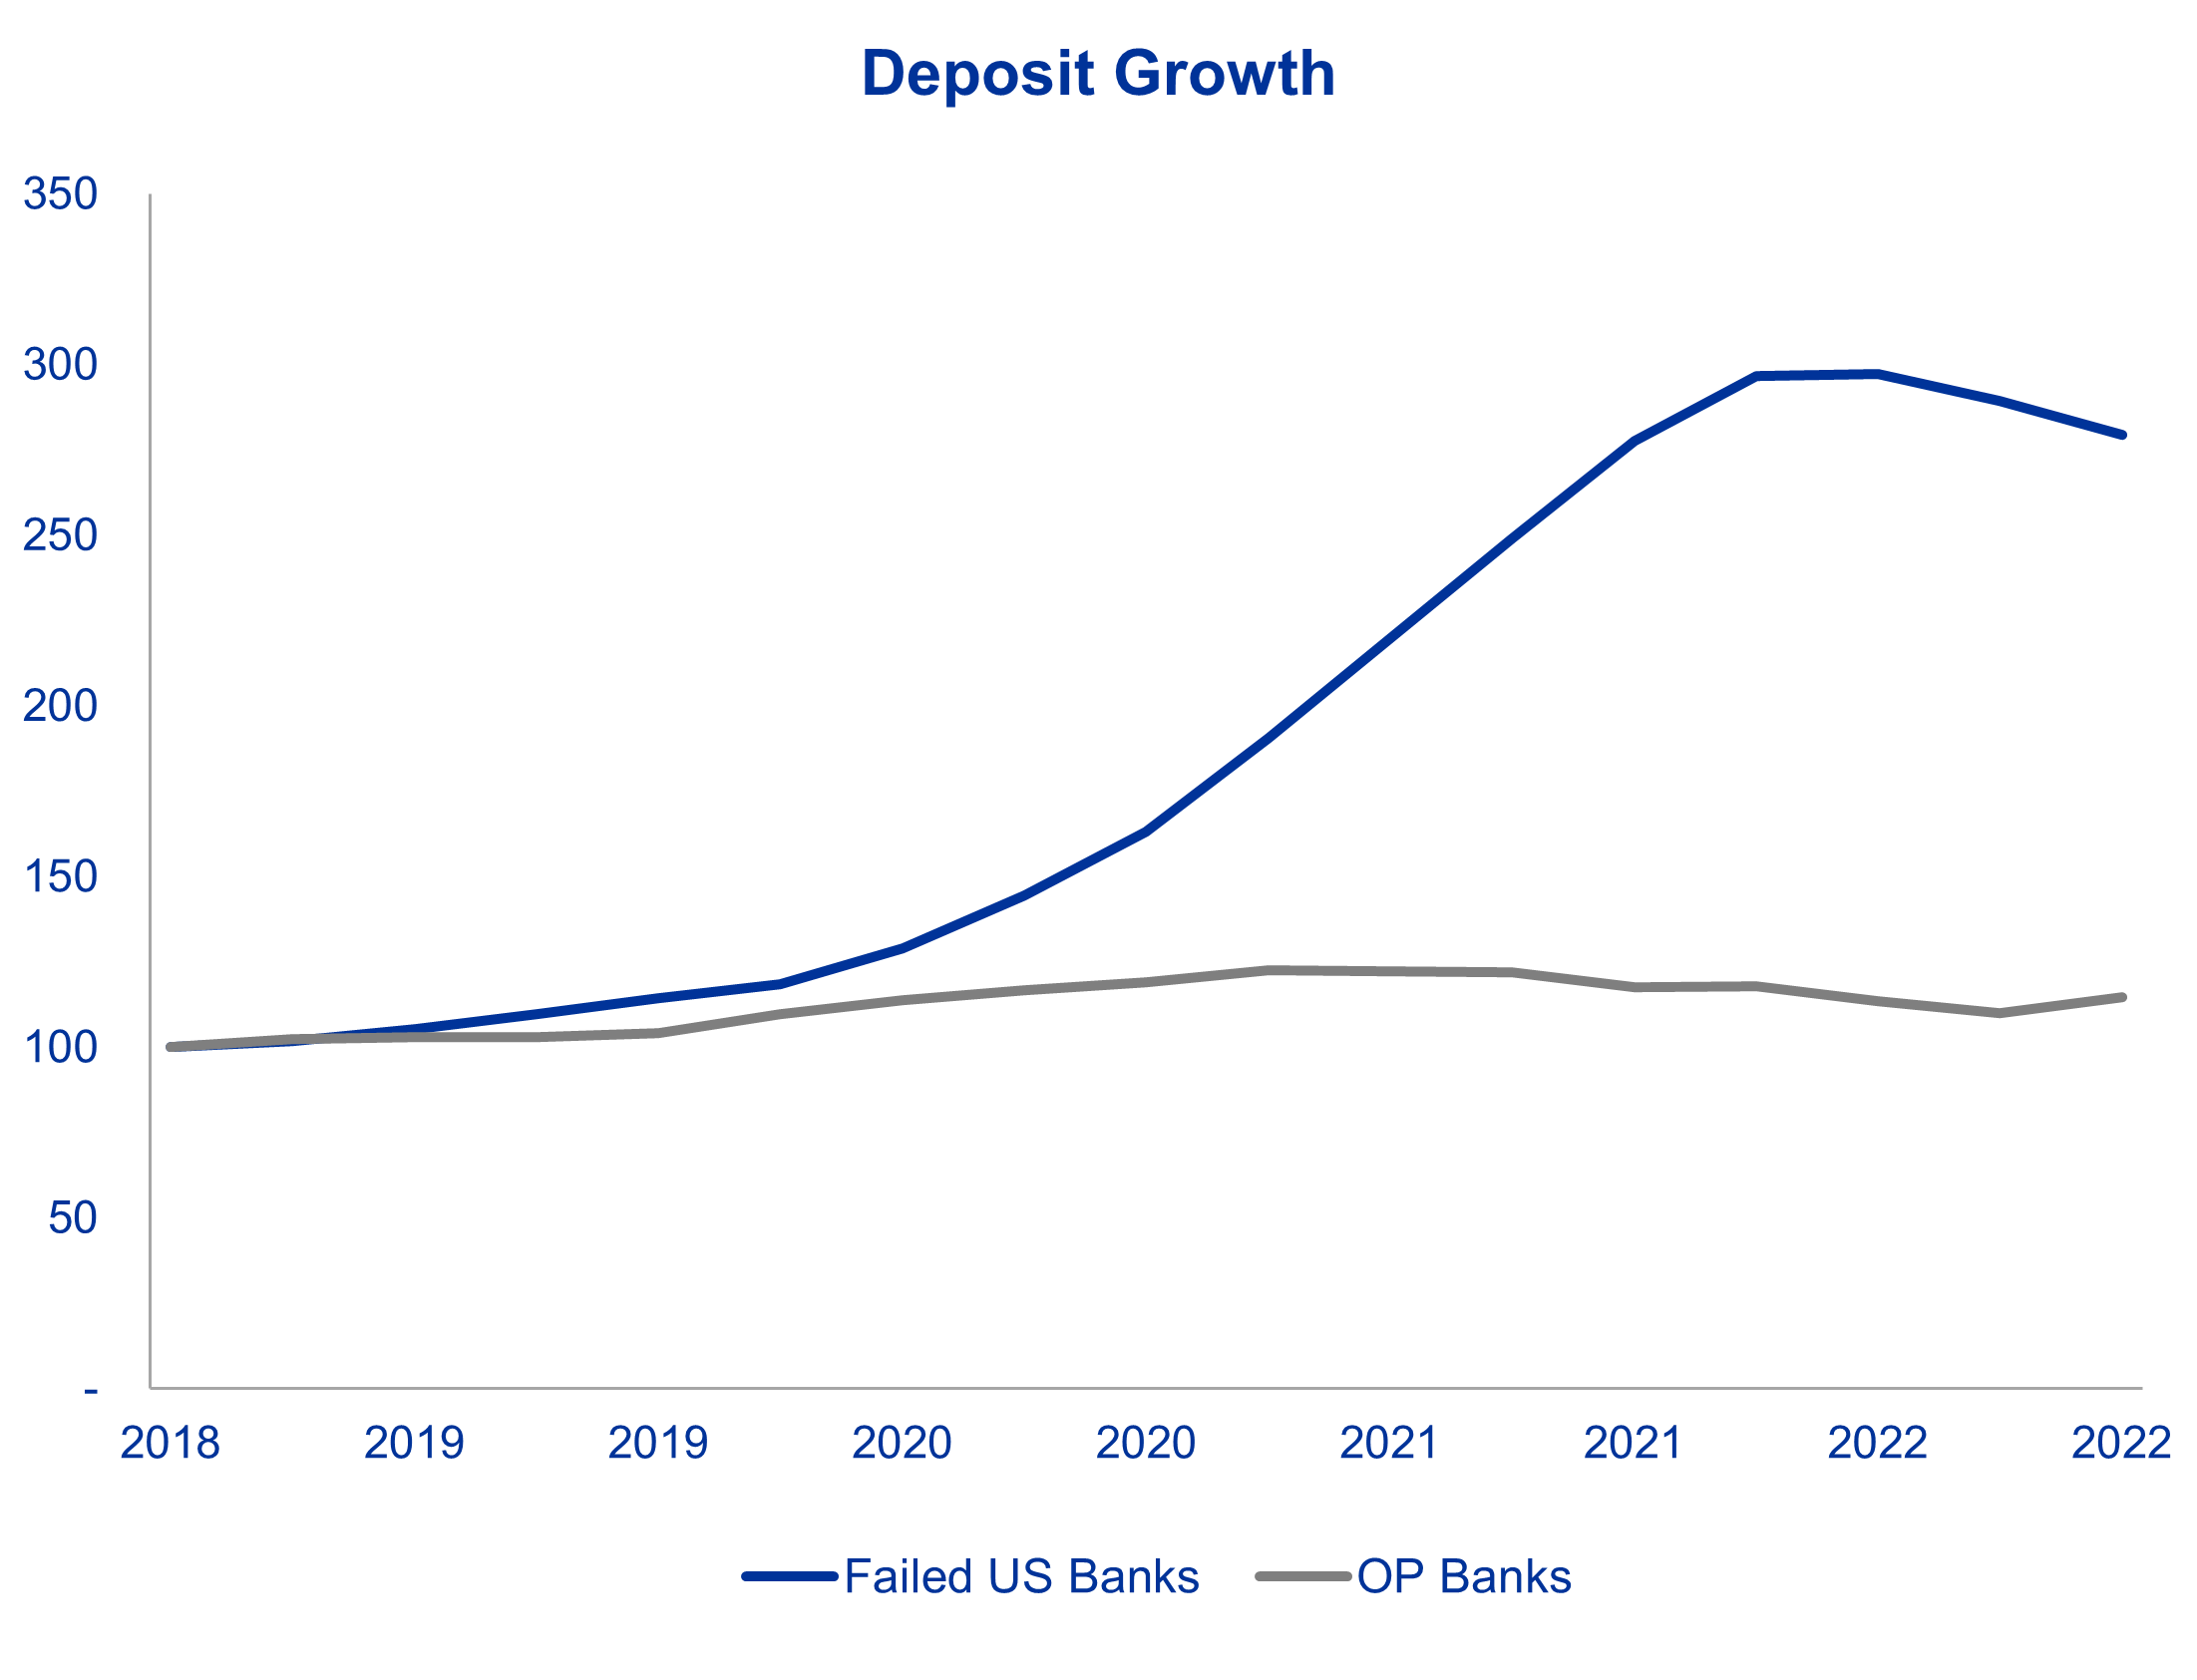
The failed US banks and other US regional banks saw substantial deposit inflows during the pandemic with deposits more than doubling between the beginning of 2020 and the end of 2021. Moreover, unlike the stickier retail deposits that underpin many of the larger banks’ liabilities, these were higher risk corporate deposits, notably significantly larger than the average retail deposit and arguably more prone to be called back at short notice.

Source: OP and Bloomberg, rebased to 100 at 31st December 2018.
Note: OP banks include Citigroup, MUFG, Lloyds, Handelsbanken and Synchrony; Failed US banks include SVB, Signature and FRC.
In hindsight, it is easy to highlight this issue, but there were banks who identified the issue in advance. The CFO of M&T bank, a US regional bank, said in November 2022, “We always had a view that it [deposits] was probably going to flow out as much as it came in, and the question was how long would it take for that to happen.”At OP we shared this concern, and therefore focused on the far less exciting – but far more robust - banks. In the context of Aesop’s fable, ‘The Tortoise and the Hare’, the banks in which we have invested are much more tortoise than hare.
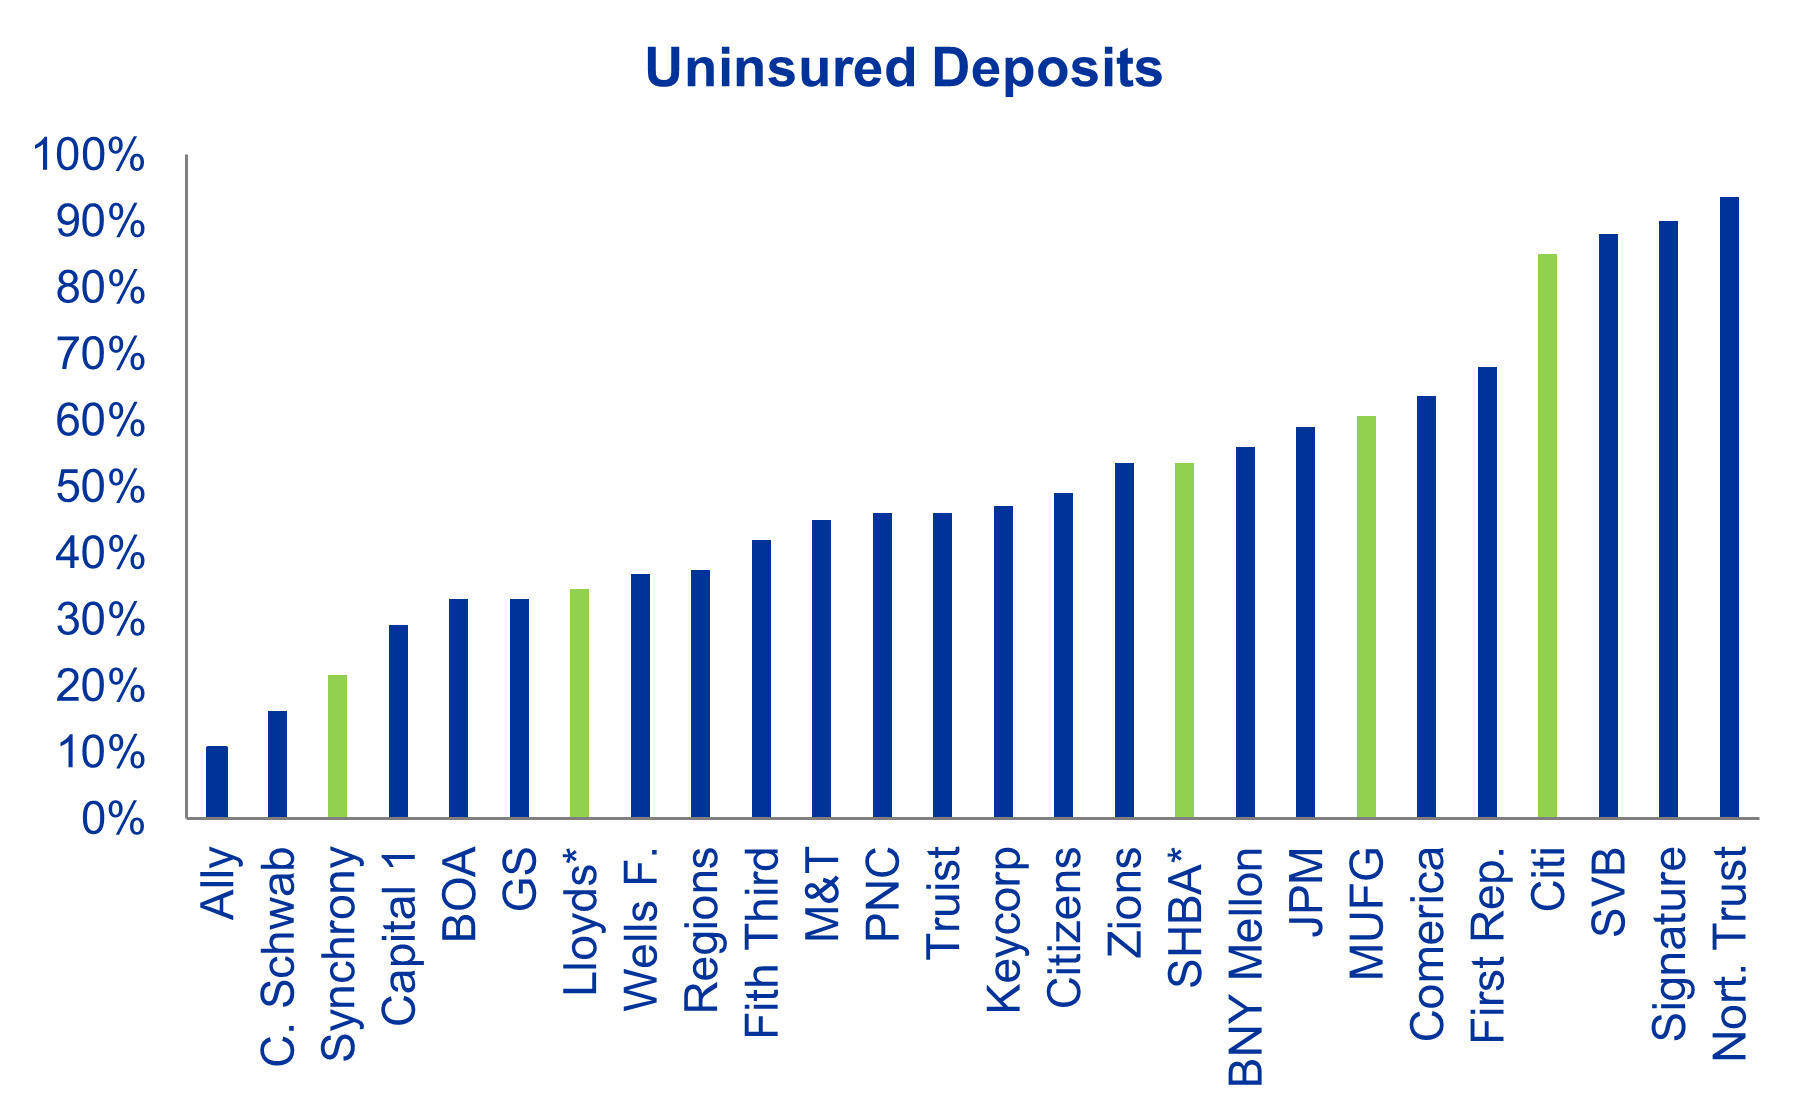
Fortunately for the system, governments have long recognised the importance of deposits and, following the Great Depression, introduced deposit insurance schemes to instil confidence for most retail depositors when rumour and concern may otherwise create panic in the banking system. While the level of deposit insurance in the US was raised to $250,000 during the Great Financial Crisis of 2008, this leaves most corporate deposits uninsured, ensuring competent corporate treasury teams shoot and ask questions later when it comes to moving their precious deposits.

Source: OP and Company annual reports.
Note: Green bars are OP investments, * Lloyds and Handelsbanken are based on retail deposits.
The chart above shows how big uninsured deposits are as a percentage of total deposits. Unfortunately, this does not show the whole picture – not all banks are created equal. On the right-hand side, among the banks with the higher levels of uninsured deposits, we find the banks that have failed (SVB, Signature and First Republic). However, this area of the chart also includes the likes of Citigroup and Northern Trust. These two banks’ business models generate a disproportional number of corporate deposits; however, these deposits are from a diversified group of corporate customers, unlike some of the failed banks where the deposits were from a concentrated group.
On the left-hand side are Ally, Synchrony (owned in our Global Equity Income strategy) and Charles Schwab. The former two are specialist lenders, and Charles Schwab is an investment platform. These are all banks, but they have very different underlying businesses and therefore different risks. These differences can be more easily seen when comparing the cost of funding. Synchrony and Ally have deposit costs of over 2%, among the highest in the industry, as they have built online retail banks capturing high-cost marginal deposits. By contrast, Schwab’s deposits are largely uninvested cash that customers keep in their investment accounts that pay little or no interest currently, leading to low-cost deposits. On the face of it, Schwab’s deposits look more secure than the online banks, however through 2022 the two online banks grew their deposits by nearly 10% whilst Schwab has seen a fall of nearly 20%.
Lloyds, Handelsbanken and MUFG, the other banks owned across OP strategies, have varying degrees of retail/insured deposits depending on how large or small their retail bank is compared with their corporate bank. For example, MUFG is the largest Japanese bank by assets and the 6th largest in the world with a large corporate franchise. These deposit bases have proven sticky during the current period of stress.
These three banks have high liquidity coverage, e.g. the liquidity coverage ratio (LCR), a measure of high-quality liquid assets to expected net cash outflows in 30 days in a stress scenario, is 144% for Lloyds, 163% for Handelsbanken, and MUFG 169% (US mid-size banks do not need to report this due to a weakening of the regulatory regime under President Trump).
It is worth noting here that European banks have been forced to hold more short-term government securities with a median LCR ratio of around 150% whereas the largest US banks have an equivalent ratio of 120%, suggesting lower duration risk in the European banks.
Furthermore, a large proportion of the loans in the portfolios of the banks in which we are invested are variable in nature. In the US, a greater proportion of real estate lending is done on fixed rate terms, both in residential mortgages and commercial real estate, the area of the loan book that dominates the balance sheets of most regional US banks.
Reaching for yield
In the US, awash with liquidity several banks took on a material amount of duration risk by investing in longer dated fixed instrument securities than would usually be prudent. They did this through 2020 and 2021 when the yield available on these instruments was around 2%. Following the actions of the Federal Reserve over the last 16 months, the equivalent instruments now yield more than twice as much leaving holders nursing large capital losses on any sales today. The combination of lower-than-average liquidity, high levels of uninsured deposits and a realisation that SVB had incurred large mark to market losses on these instruments ultimately caused the failure of SVB.
Other banks such as Ally and Synchrony have taken more credit risk than SVB, Signature and FRC but have done so as specialist lenders: Ally’s business is largely asset-backed auto loans while Synchrony is focussed on store-based credit cards. They get compensated with higher interest rates on their products and the average life of their lending book is shorter-term and therefore their assets reprice much sooner, allowing them to make good returns despite rising costs of deposits. So far this banking crisis has been characterised by taking too much duration risk rather than too much credit risk. As is often the case the risk was not where everyone was looking.
Capital levels can be illusory
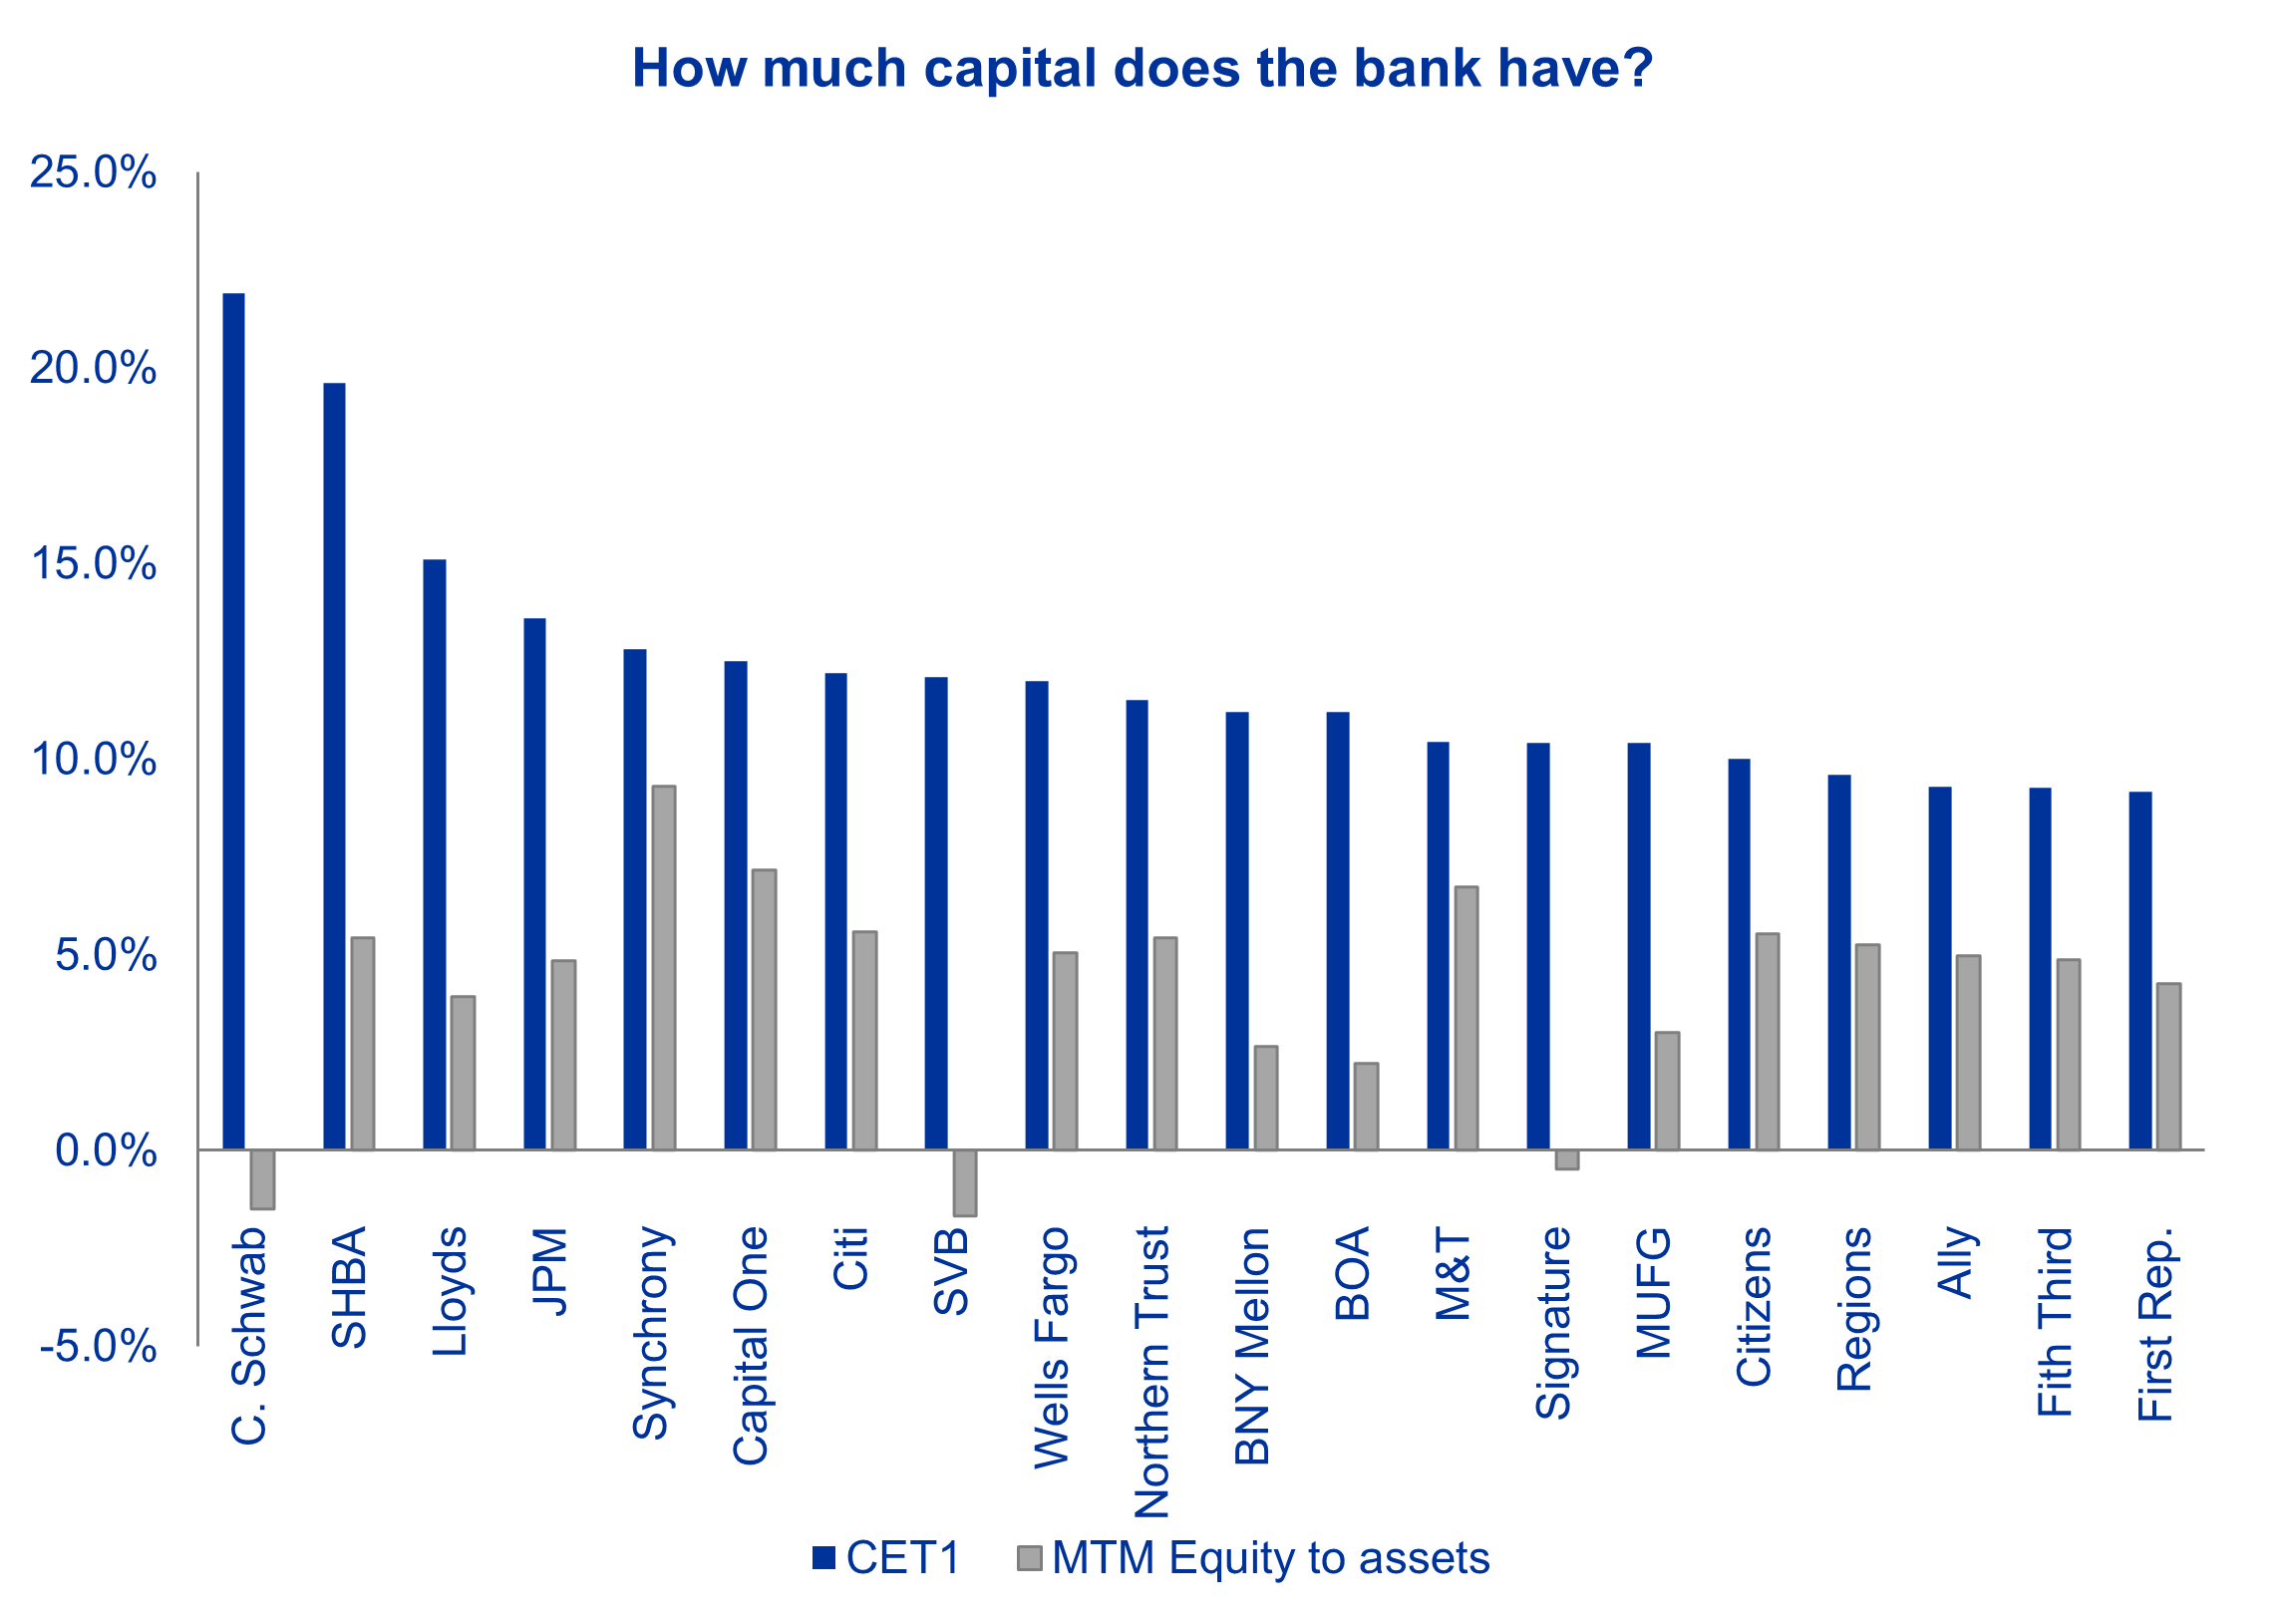
Since the Great Financial Crisis, regulators have been focussed on credit risk, with a focus on stress testing and with a focus on Common Equity Tier 1 (CET1) ratios that attempt to normalise for the credit risk of assets rather than focusing on the risk of sharply rising rates.
The chart below shows the CET1 ratios of major US banks and the banks held across our strategies in blue. To this we have added a simple tangible equity to assets ratio adjusted for the mark to market losses on the securities owned by the banks in red. We can see three banks with negative adjusted tangible equity: Schwab, Signature and SVB. Two of these have failed. This alone suggests that CET1 ratios are not satisfactory tools to assess bank risk.

Source: Bloomberg, 10k, Annual Reports, OP.
Note: MTM Equity to assets is a mark to market of the AFS and HTM securities portfolios.
Credit risk may yet play its part
There is another way that a bank can reach for yield not captured in this analysis. FRC is the third bank that has suffered a run on deposits and failed. They had a very high share of uninsured deposits for a regional bank, third in the rankings of the regional banks after SVB and Signature. However, they don’t have very much in the way of long duration tradable securities but around 80% of the bank’s loans were long duration fixed rate mortgages compared with around 40% at other US banks.
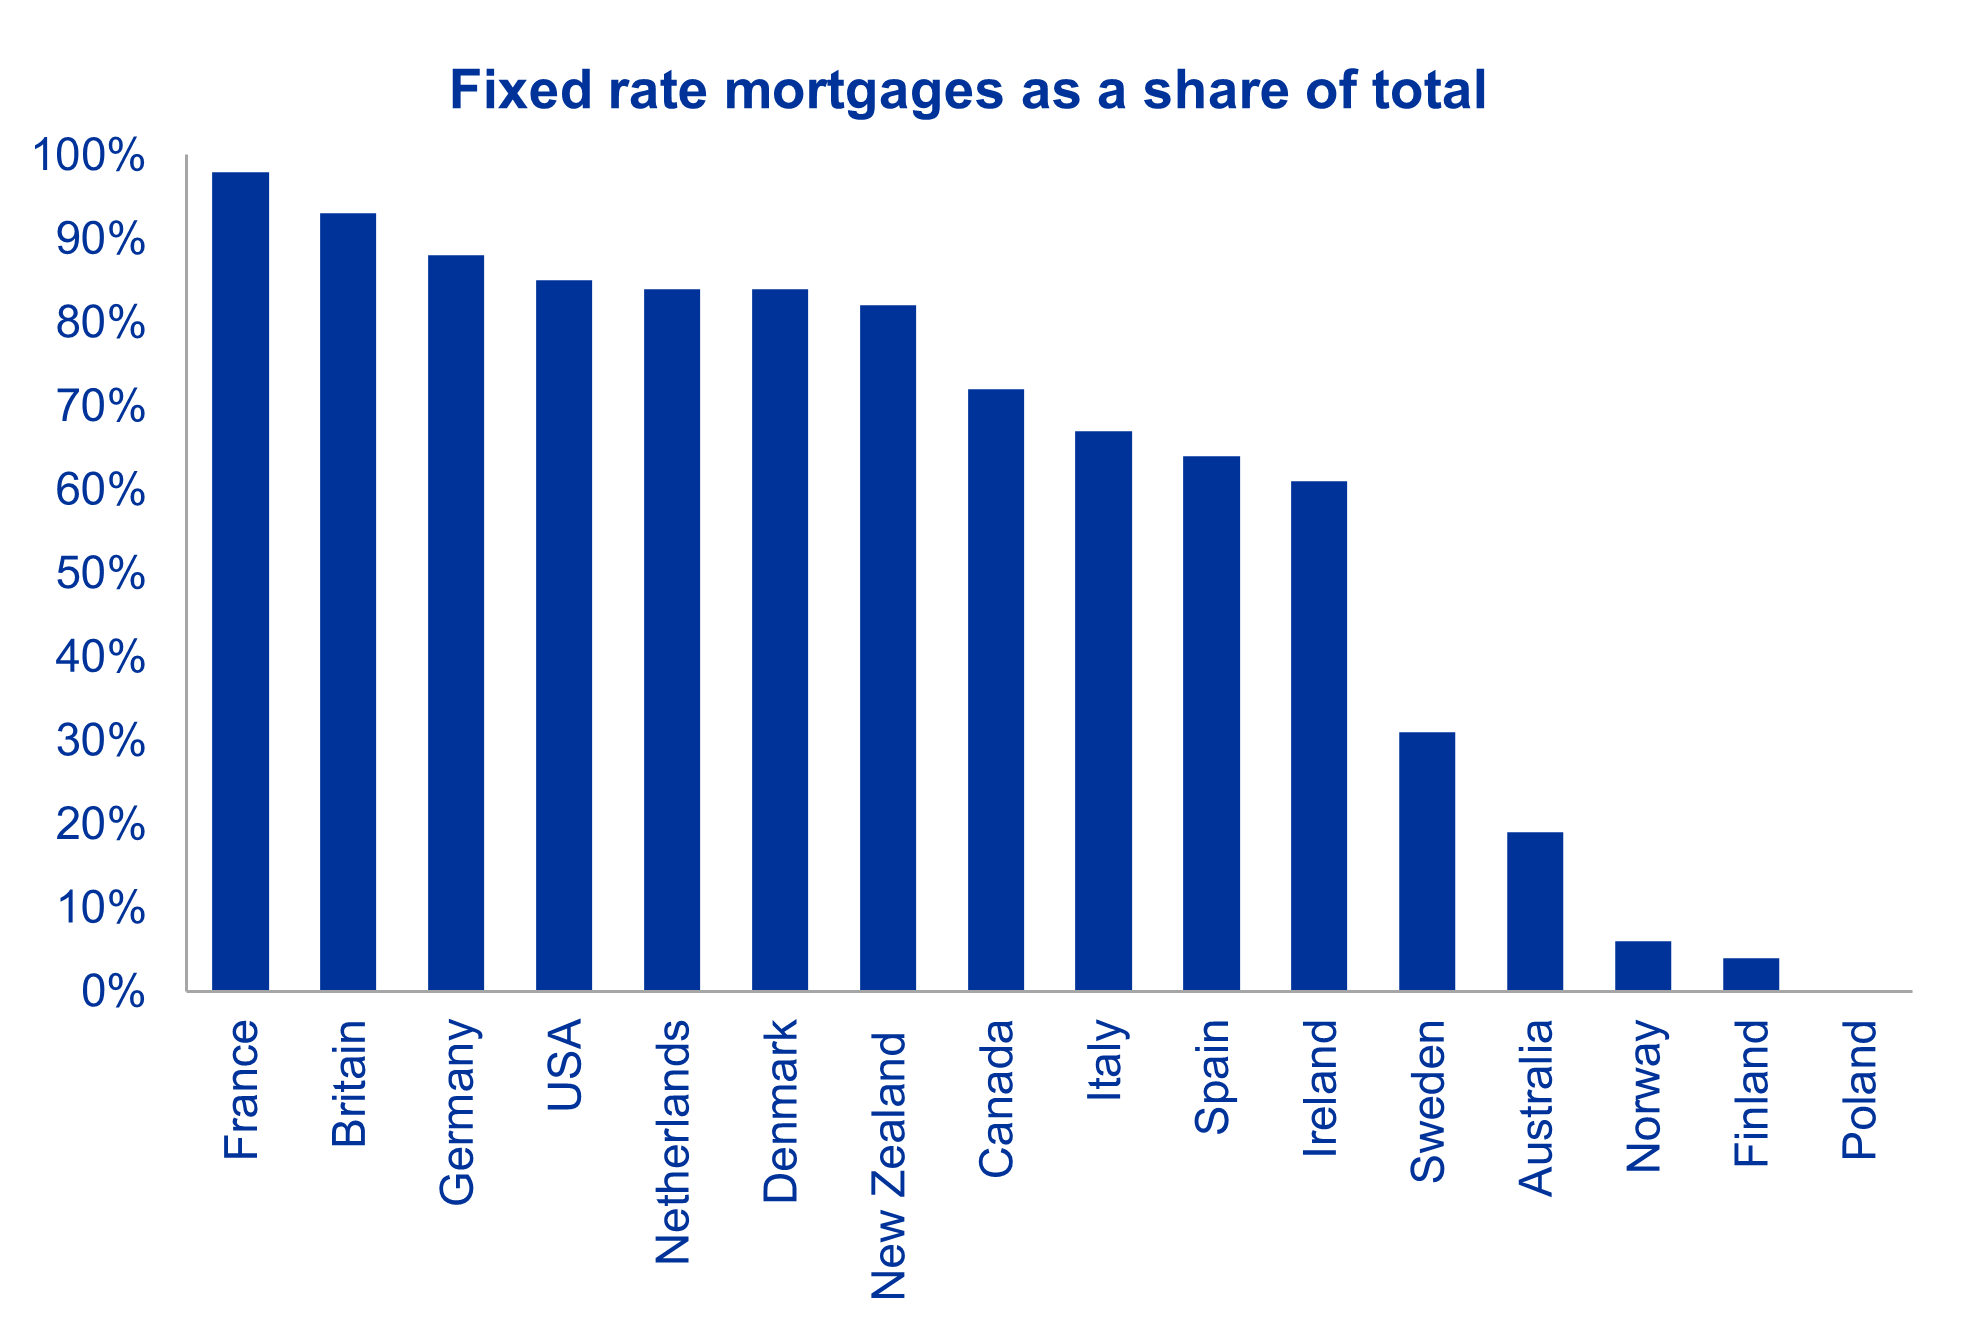
This dynamic of long dated fixed rate mortgages is a possible risk for banks in other markets too. However, as the below chart shows there are no blanket rules that can be applied across the world. Again, just analysing the share of fixed rate mortgages gives half the story.

Source: Economist as of 2018 or latest available.
The two markets with the largest share of fixed rate mortgages are France and Britain. In France the typical fixed term at the start of a mortgage is twenty years, whereas in Britain it is between two and five years suggesting material differences in duration risk for lenders between these two markets, hence we are comfortable with our Lloyds risk despite it operating in a market with a large share of fixed rate mortgages and mortgages being a large share of their book.
That said, as we mentioned earlier, the area of greatest credit concern among the US regional banks is exposure to commercial real estate. Here there are a few areas to watch: 1) fixed rate lending and the need for borrowers to refinance at current interest rates; 2) the impact of rising capitalisation rates on the value of the commercial real estate assets, and 3) the structural shift to hybrid working that has undermined occupancy rates in the office market. While the majority of this lending is handled by the US regional banks, we noted the recent example of the 22-storey office block at 350 California Street in San Francisco (formally home to Union Bank) that was valued in 2019 at $300m but today, ravaged by the loss of Union Bank as a tenant and the lower demand for office space due to hybrid working, is expected to sell for about $60m. Nearly 30% of San Francisco’s office space is vacant today.
Banks held within the OP strategies
While investing in all banks comes with the fundamental problem that investors don’t know the precise detail of the asset and loan portfolio, our assessment is that the banks held across OP strategies are better capitalised and better managed than the failed US banks or Credit Suisse.
The banks that are in the OP portfolios do not suffer from the issue of the banks that have failed. In the US we are invested in Synchrony and Citigroup which we have discussed above. Beyond the US we have investments in Lloyds, Handelsbanken and MUFG with diverse and relatively low-cost depositor bases and large amounts of liquidity. We would expect the respective sizes and reputations in their local markets to provide these banks with a similar role to the largest US banks as likely homes for any deposit flight from smaller banks should depositor unease spread globally.
Most banks have reported losses on their bond portfolios as interest rates have risen, the hit to capital appears to have been comfortably managed to-date. Common Equity Tier 1 (CET1) ratios remain robust: over 14% at Lloyds, 19% at Handelsbanken, and 10% at MUFG, substantially higher than 2008. Crucially, when marking to market the securities on the balance sheet they all have tangible equity ratios of around 5%. As such, we believe that the issues associated with the US banks are unlikely to be repeated at these banks.
The issues that have hit SVB, Signature, FRC and other US regional banks appear to have something in common – these look to be the traditional issue banks face that have borrowed short and lent long. Credit Suisse appears to be a different beast with many idiosyncratic problems of their own. However, the root cause of a ‘rotten’ culture is one to be wary of when investing in banks. The banks in which we invest do not suffer from these issues and therefore we remain confident about our investments.


