Imagine if five years ago equity investors had been offered an annual compounded return of 10.7%. Or ten years ago, the same offer at 8.5% p.a. Would most investors have taken it? We think most would have and, indeed, should have.
Simplistically, equity returns are a function of dividends, earnings growth and earnings multiple. Over the long-term, the earnings multiple becomes less important so with a ~3% dividend yield and ~5% earnings growth, equity returns should fluctuate around 8% p.a. Indeed, over the last 30 years the total return on the MSCI World Index was 8.5% p.a.
10.7% and 8.5% are the annual compounded returns for the MSCI World Value Index from 2016 and 2011 respectively. Why would anyone be dissatisfied with returns which are in line with or above long-term averages? Because they pale on a relative basis. During the same period, the MSCI World Growth Index achieved annual returns of an astonishing 19.9% and 13.9% respectively.
Does the relative underperformance of cheaper companies imply that Value investing failed in some way? And what are the implications for future returns from this relative performance? These are important questions.
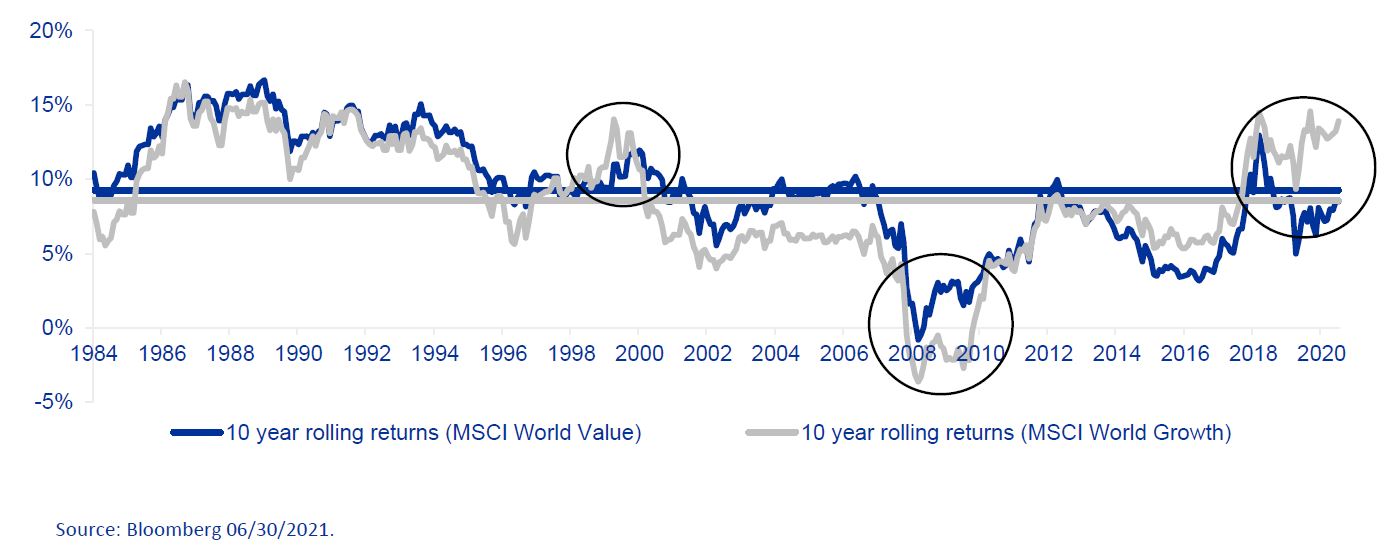
The chart below shows the 10-year annual rolling returns of the MSCI World Value Index and the MSCI World Growth Index since 1974. Returns have historically moved in line but with a few exceptions (circled): the dotcom boom (where Growth outperformed), the 2008 Financial Crisis (where Value outperformed) and today, where we see a large gap in the relative performance of Value and Growth with the 10-year annual return of the MSCI World Value Index at 8.5% and the MSCI World Growth Index at 13.9%.
Does the relative underperformance of the cheaper Value companies over the last ten years imply that Value investing has failed? Clearly, we think not. In fact, the chart explicitly shows that Value has performed in line with the average 10-year rolling returns of both Value and Growth since 1974. The picture is the same on a 5-year basis. The relative underperformance is more a case of Growth performing exceptionally well rather than Value performing badly. Value investing has not failed on an absolute basis – it has merely failed to keep up on a relative basis. We believe this distinction between relative and absolute performance is important. It also begs the question: why has Growth done so well and what are the implications for future returns?
The tables below show 5 and 10 year return attribution for the MSCI World Value Index and the MSCI World Growth Index. Let’s look at this in more detail: the 5 year annualised return of the MSCI World Growth Index (19.9% p.a.) can be attributed to 6.8% p.a. from EPS growth and 2.4% p.a. from dividend. This 9.2% p.a. is what we, at OP, call “sustainable” return (we consider EPS growth and dividends to be a more sustainable return contribution than P/E expansion). On top of this, P/E expansion from 19x in Jun-16 to 32x in Jun-21 contributed fully 10.7% p.a. to get a total return of 19.9% p.a. In other words, more than half of the return of the MSCI World Growth Index came from P/E expansion. The MSCI World Value Index, on the other hand, and over the same period delivered a “sustainable” return of 10.6% p.a., which was ahead of Growth, but benefitted just 0.1% p.a. from P/E expansion.
On a 10-year basis, the “sustainable” return of Growth (6.0% p.a.) was slightly ahead of Value (5.4% p.a.). However, Growth again benefitted from a significant P/E expansion which led to superior returns.
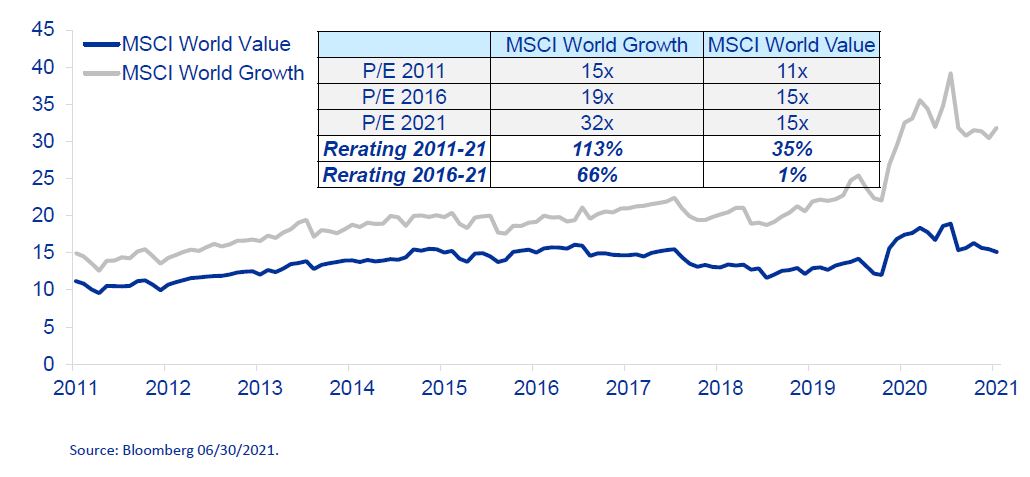
P/E expansion has clearly been the main difference in performance between Value and Growth. To illuminate this point, consider the chart below. The P/E of the MSCI World Growth Index increased from 15x in 2011 to 32x in 2021 (+113% or 7.9% p.a.) versus the MSCI World Value Index from 11x to 15x (+35% or 3.1% p.a.). Whilst we do not know whether the multiple expansion halts or reverses, we do know that it cannot go on indefinitely and that a reversal would have a dramatic impact on relative performance. As an example, if the valuation tailwind experienced over the last 10 years reverses, Growth would return minus 1.9% p.a. (6.0% p.a. “sustainable” return minus 7.9% p.a. P/E contraction from the table above) and Value would return 2.3% p.a. (5.4% p.a. minus 3.1% p.a.), a difference of fully 4.2% p.a. This is not a prediction, but it does put into perspective the impact from P/E expansion over the last ten years.
There are two important takeaways here. First, the underperformance of Value is more a case of Growth doing extraordinarily well rather than Value doing very badly. At an absolute level, Value has delivered as expected – it is only at a relative level that Value has performed poorly. Second, the returns of Value were achieved without the multiple expansion tailwind seen in Growth which we believe leaves much less valuation risk today in traditional Value companies. If the multiple expansion enjoyed by Growth companies turns into even a slight headwind, the relative outperformance of Value would be significant – even if the absolute returns for Value stay in line with historical returns.


